
 As part of our annual summer intern program (now called the Carnegie Astrophysics Summer Student Internship program, or CASSI), we run a python workshop. The purpose of this is to help bring our interns, who have a diverse range of experience with programming and python, to a common footing.

Part of this involves writing a bunch of (what we hope are) helpful notebooks, illustrating how python can be used for solving particular problems. I’ve written 4 notebooks that illustrate model-fitting with python, using least-squares and Markov Chain Monte Carlo (MCMC) methods.
I’ve put these on the Google Colaboratory in case anyone else finds them useful. The first three deal with fitting something akin to a spectral line with a Gaussian profile and background. The fourth looks at fitting x/y data when you have errors in both x and y. This leads to a bias that many are not familiar with and addresses why it happens and how to fix it. The links are here:
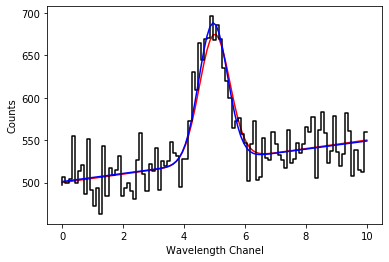
- Non-linear least-squares fitting with python: make some fake emission line data and fit it using scipy’s curve_fit function. Also shows how to make an error-ellipse based on the covariance matrix.
- Using emcee to do the same line fitting: shows how to build a predictive statistical model and use emcee to solve it. Also shows the use of corner plots for visualizing the covariance of the parameters.
- Using pystan to do it yet again. Emcee’s great, but has a hard time with large parameters spaces, so we’ll do it again using pystan.
- Fitting a straight line to X/Y data is pretty common. But if you have errors in both X and Y values, least-squares will give you a biased answer. Here’s a notebook that demonstrates the problem and one way to fix it.